


 87 128

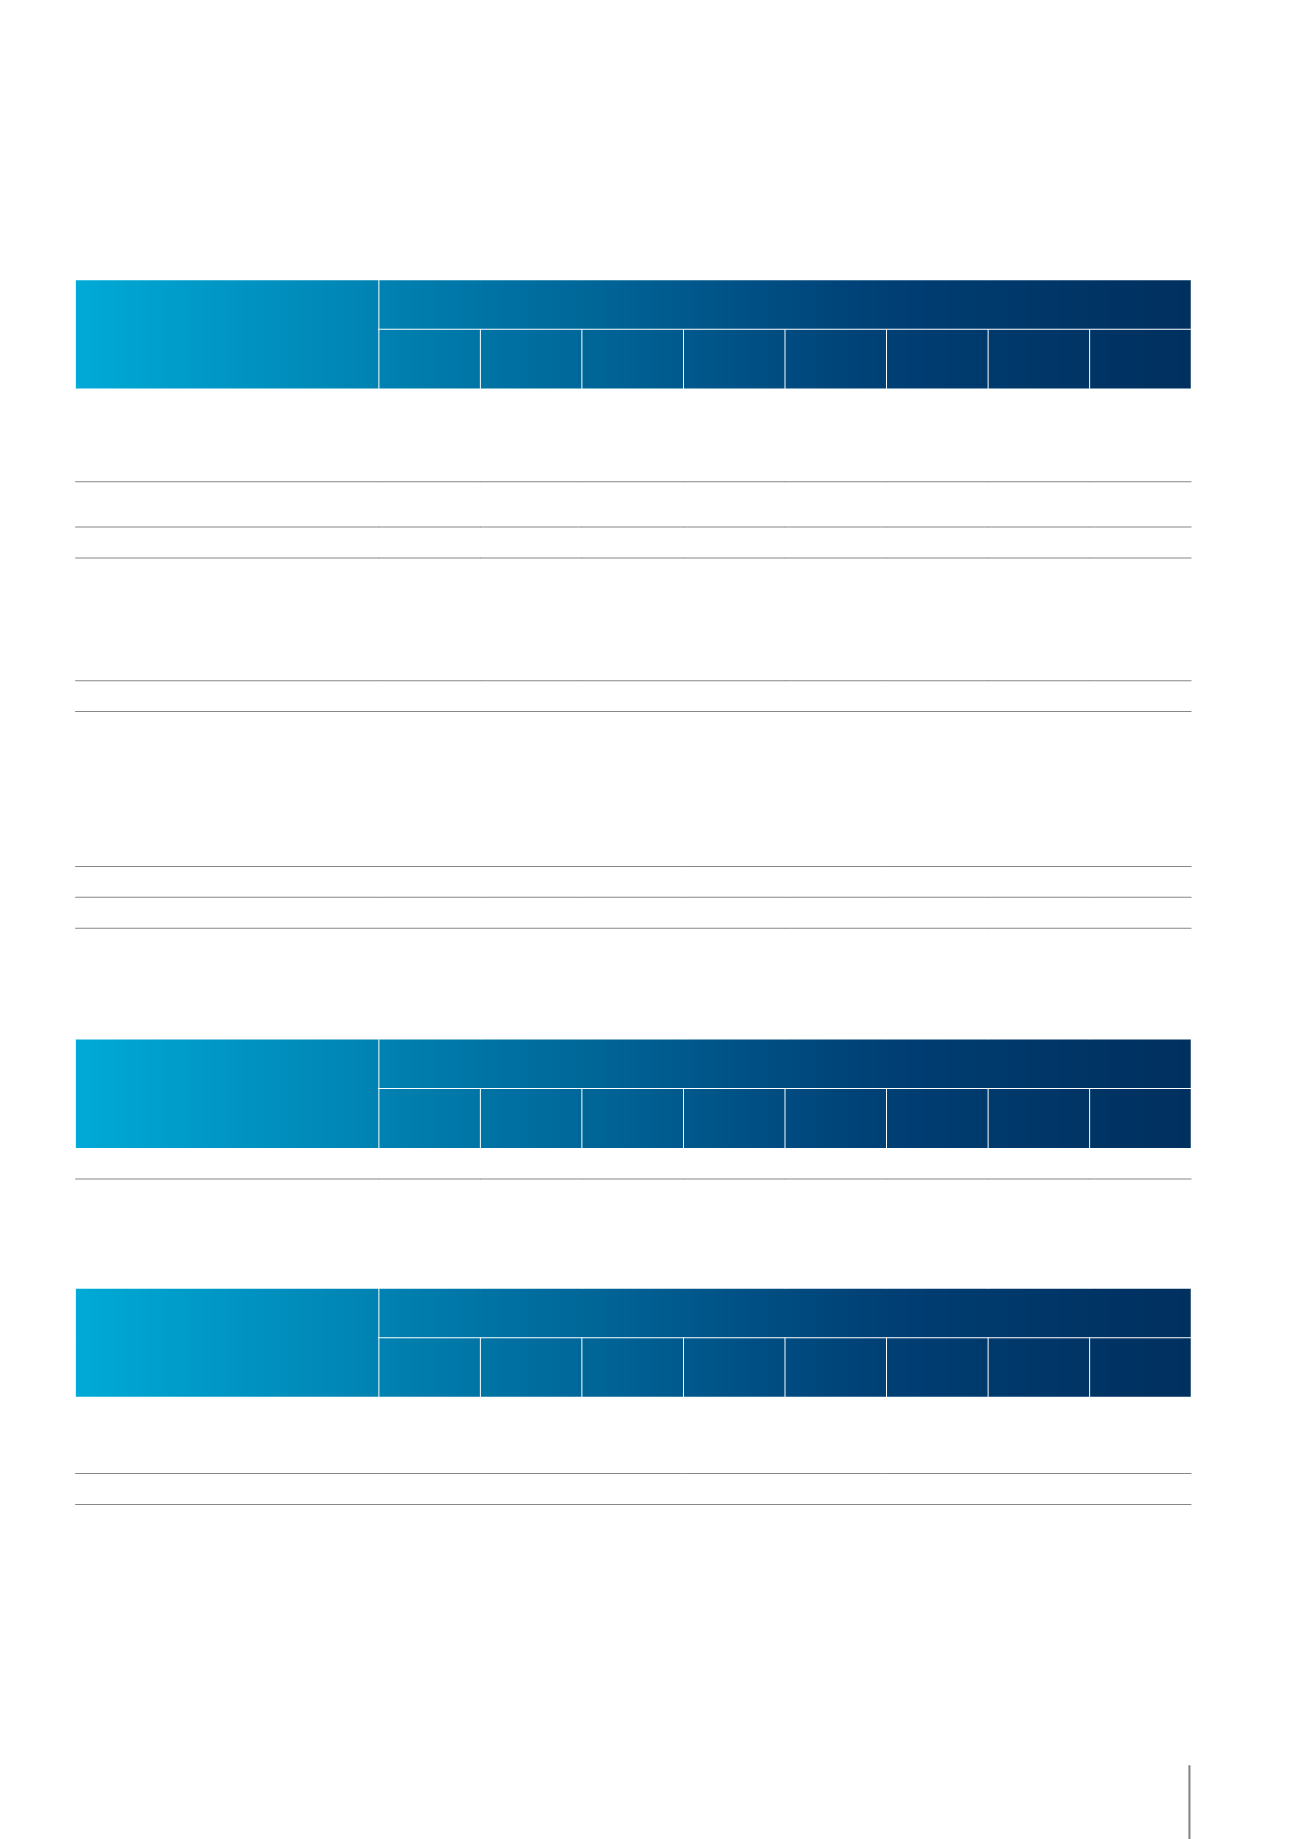
EN ’000 €
2015
BELGIQUE
FRANCE
ESPAGNE
PAYS-BAS LUXEMBOURG
AUTRES
(POLOGNE ET
SUISSE)
NONAFFECTÉ
TOTAL
Capital et primes d’émission
20 106
20 106
Réserves consolidées
103 721
103 721
Réserves de conversion
-794
-794
Capitaux propres attribuables aux
propriétaires de la société mère
123 033 123 033
Total des capitaux propres
123 033 123 033
Obligations financières
214 000 214 000
Provisions
2 251
205
4 705
7 161
Passifs d’impôt différé
19 868
19 868
Autres dettes
1 289
8 668
153
14
10 124
Passifs non courants
3 540
8 873
153
4 719
233 868 251 153
Dépassements bancaires
44
44
Obligations financières
8 714
8 714
Dettes commerciales et autres dettes
50 410 18 654
6 912
7 492
2 645
853
86 966
Provisions
137
616
753
Impôts courants
20 036 20 036
Passifs courants
50 547
19 270
6 912
7 492
2 645
853
28 794 116 513
TOTAL DES PASSIFS
54 087
28 143
7 065
12 211
2 645
853 385 695 490 699
ÉTAT DE SITUATION FINANCIÈRE – PASSIFS
EN 000 €
2015
BELGIQUE
FRANCE
ESPAGNE
PAYS-BAS LUXEMBOURG
AUTRES
(POLOGNE ET
SUISSE)
NONAFFECTÉ
TOTAL
INVESTISSEMENTS
7 244
1 990
2 876
41 422
3
87
53 622
INVESTISSEMENTS
EN ’000 €
2015
BELGIQUE
FRANCE
ESPAGNE
PAYS-BAS LUXEMBOURG
AUTRES
(POLOGNE ET
SUISSE)
NONAFFECTÉ
TOTAL
Amortissements, pertes de valeur et
provisions
12 427
5 475
2 693
1 809
575
516
23 495
Autres
255
3
1
259
TOTAL
12 682
5 478
2 694
1 809
575
516
23 754
ÉLÉMENTS HORS TRÉSORERIE
87
05 / COMPTES ANNUELS
KINEPOLIS GROUP
RAPPORT ANNUEL 2016