


 80 / 124

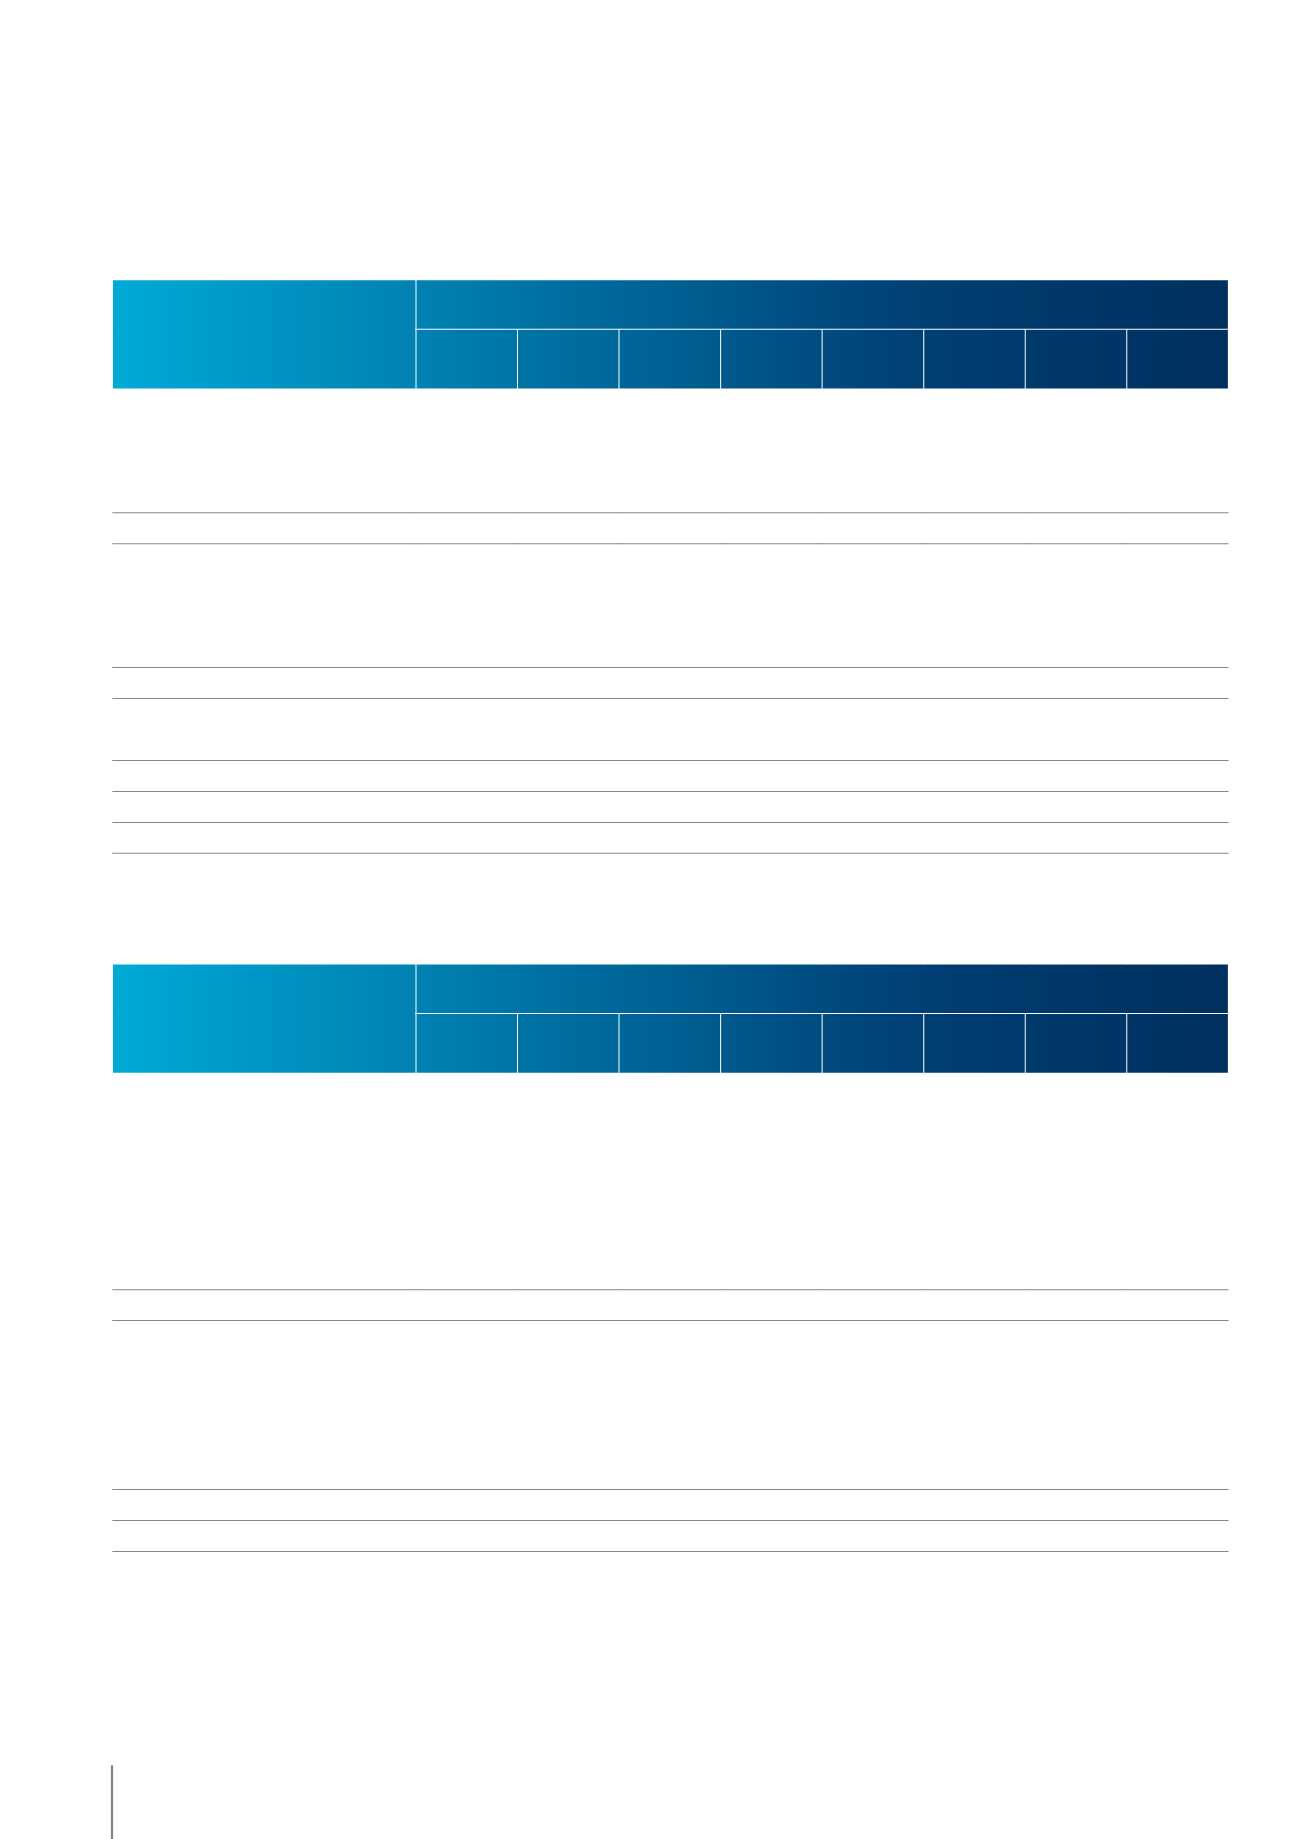
ÉTAT DE SITUATION FINANCIÈRE – ACTIFS
EN ’000 €
2015
BELGIQUE
FRANCE
ESPAGNE
PAYS-BAS LUXEMBOURG
AUTRES
(POLOGNE ET
SUISSE)
NONAFFECTÉ
TOTAL
Produits des secteurs
187 990 65 169
41 579
23 114
3 428
4 937
326 217
Produits inter-secteurs
-23 164
-823
-546
-3
-66
-44
-24 646
Produits
164 826
64 346
41 033
23 111
3 362
4 893
301 571
Coûts des ventes
-107 035
-42 182 -30 309
-16 551
-2 820 -3 096
-201 993
Marge brute
57 791
22 164
10 724
6 560
542
1 797
99 578
Frais de commercialisation
-11 657
-2 474
-2 157
-970
-74
-206
-17 538
Charges administratives
-13 189
-1 386
-833
-1 871
-94
-343
-17 716
Autres produits opérationnels
226
764
5
1
182
-1
1 177
Autres charges opérationnelles
-235
-13
-8
-256
Résultat du secteur
32 936
19 055
7 739
3 712
556
1 247
65 245
Produits financiers
1 140
1 140
Charges financières
-8 894
-8 894
Résultat avant impôt
57 491
Charge d’impôt
-25 236 -25 236
RÉSULTAT DE LA PÉRIODE
32 255
EN ’000 €
2015
BELGIQUE
FRANCE
ESPAGNE
PAYS-BAS LUXEMBOURG
AUTRES
(POLOGNE ET
SUISSE)
NONAFFECTÉ
TOTAL
Immobilisations incorporelles
4 476
384
250
1
5 111
Goodwill
6 586
11 804
2 858
19 661
5 845
6 502
53 256
Immobilisations corporelles
80 732
70 255
47 650 68 556
14 796
7 212
289 201
Immeubles de placement
14 082
6 721
11 162
31 965
Actifs d’impôt différé
670
670
Autres créances
34
11 318
483
-20
30
11 845
Autres actifs financiers
27
27
Actifs non courants
105 910 93 761
57 962
88 197
20 672
24 876
697 392 075
Stocks
3 056
665
480
332
91
70
4 694
Créances commerciales et autres
actifs
20 559
6 584
1 434
2 088
2 114
213
32 992
Créances d’impôt courant
442
442
Trésorerie et équivalents de trésorerie
60 432
60 432
Instruments financiers dérivés
64
64
Actifs courants
23 615
7 249
1 914
2 420
2 205
283
60 938 98 624
TOTAL DES ACTIFS
129 525 101 010 59 876
90 617
22 877
25 159
61 635 490 699
COMPTE DE RÉSULTATS
Informations sectorielles au 31 décembre 2015
78
05 / COMPTES ANNUELS
KINEPOLIS GROUP
RAPPORT ANNUEL 2015