


 3 128
3 128

a/opbrengsten 2016
29.1%
30.3%
28.3%
30.2%
25.0
30.0
35.0
32.5
27.5
2012
2013
2014
2015
2016
29.1%
rebitda/opbrengsten 2016
Netto financiële schuld / eigen vermogen 2016
0.6
0.9
1.2
1.5
29.1%
30.3%
28.3%
30.2%
25.0
30.0
35.0
32.5
27.5
2012
2013
2014
2015
2016
29.1%
0.83
0.84
1.13
1.32
2012
2013
2014
2015
2016
1.13
25
30
35
,6
,9
,2
,5
21.8%
22.9%
20.9%
21.5%
rebitda/opbrengsten 2016
Roce 2016
15.0
20.0
25.0
22.5
17.5
2012
2013
2014
2015
2016
Netto financiële schuld / eigen vermogen 2016
0.6
0.9
1.2
1.5
17.9%
29.1%
30.3%
28.3%
30.2%
25.0
30.0
35.0
32.5
27.5
2012
2013
2014
2015
2016
29.1%
0.83
0.84
1.13
1.32
2012
2013
2014
2015
2016
1.13
25
30
35
0,6
0,9
1,2
1,5
15
20
25
DATAPER SHARE
(3)
2012
2013
2014
2015
2016
Revenue
8.77
9.06
9.99
11.26
11.94
EBITDA
2.49
2.76
2.71
3.31
3.37
REBITDA
2.55
2.75
2.82
3.40
3.48
Profit
1.23
1.38
1.34
1.20
1.75
Current profit
1.29
1.38
1.35
1.61
1.48
Equity share of the Group
3.75
3.85
3.89
4.59
5.51
Gross dividend
(4) (5)
0.47
0.64
0.65
0.79
0.87
Pay-out ratio
35%
45%
50%
50%
50%
RATIOS
(3) Calculation based on the weighted average number of shares for the relevant period, multiplied by five for the period
2011 through 2013, to take account of the share split in 2014 and enable a comparison of the figures.
(4) Calculation based on the number of dividend eligible shares. For the years 2012 and 2013 divided by 5, bearing in mind
the splitting of each share in five shares on 1 July 2014 for the sake of comparison.
(5) An additional exceptional dividend of € 0.20 per share was paid out for the fiscal year 2014
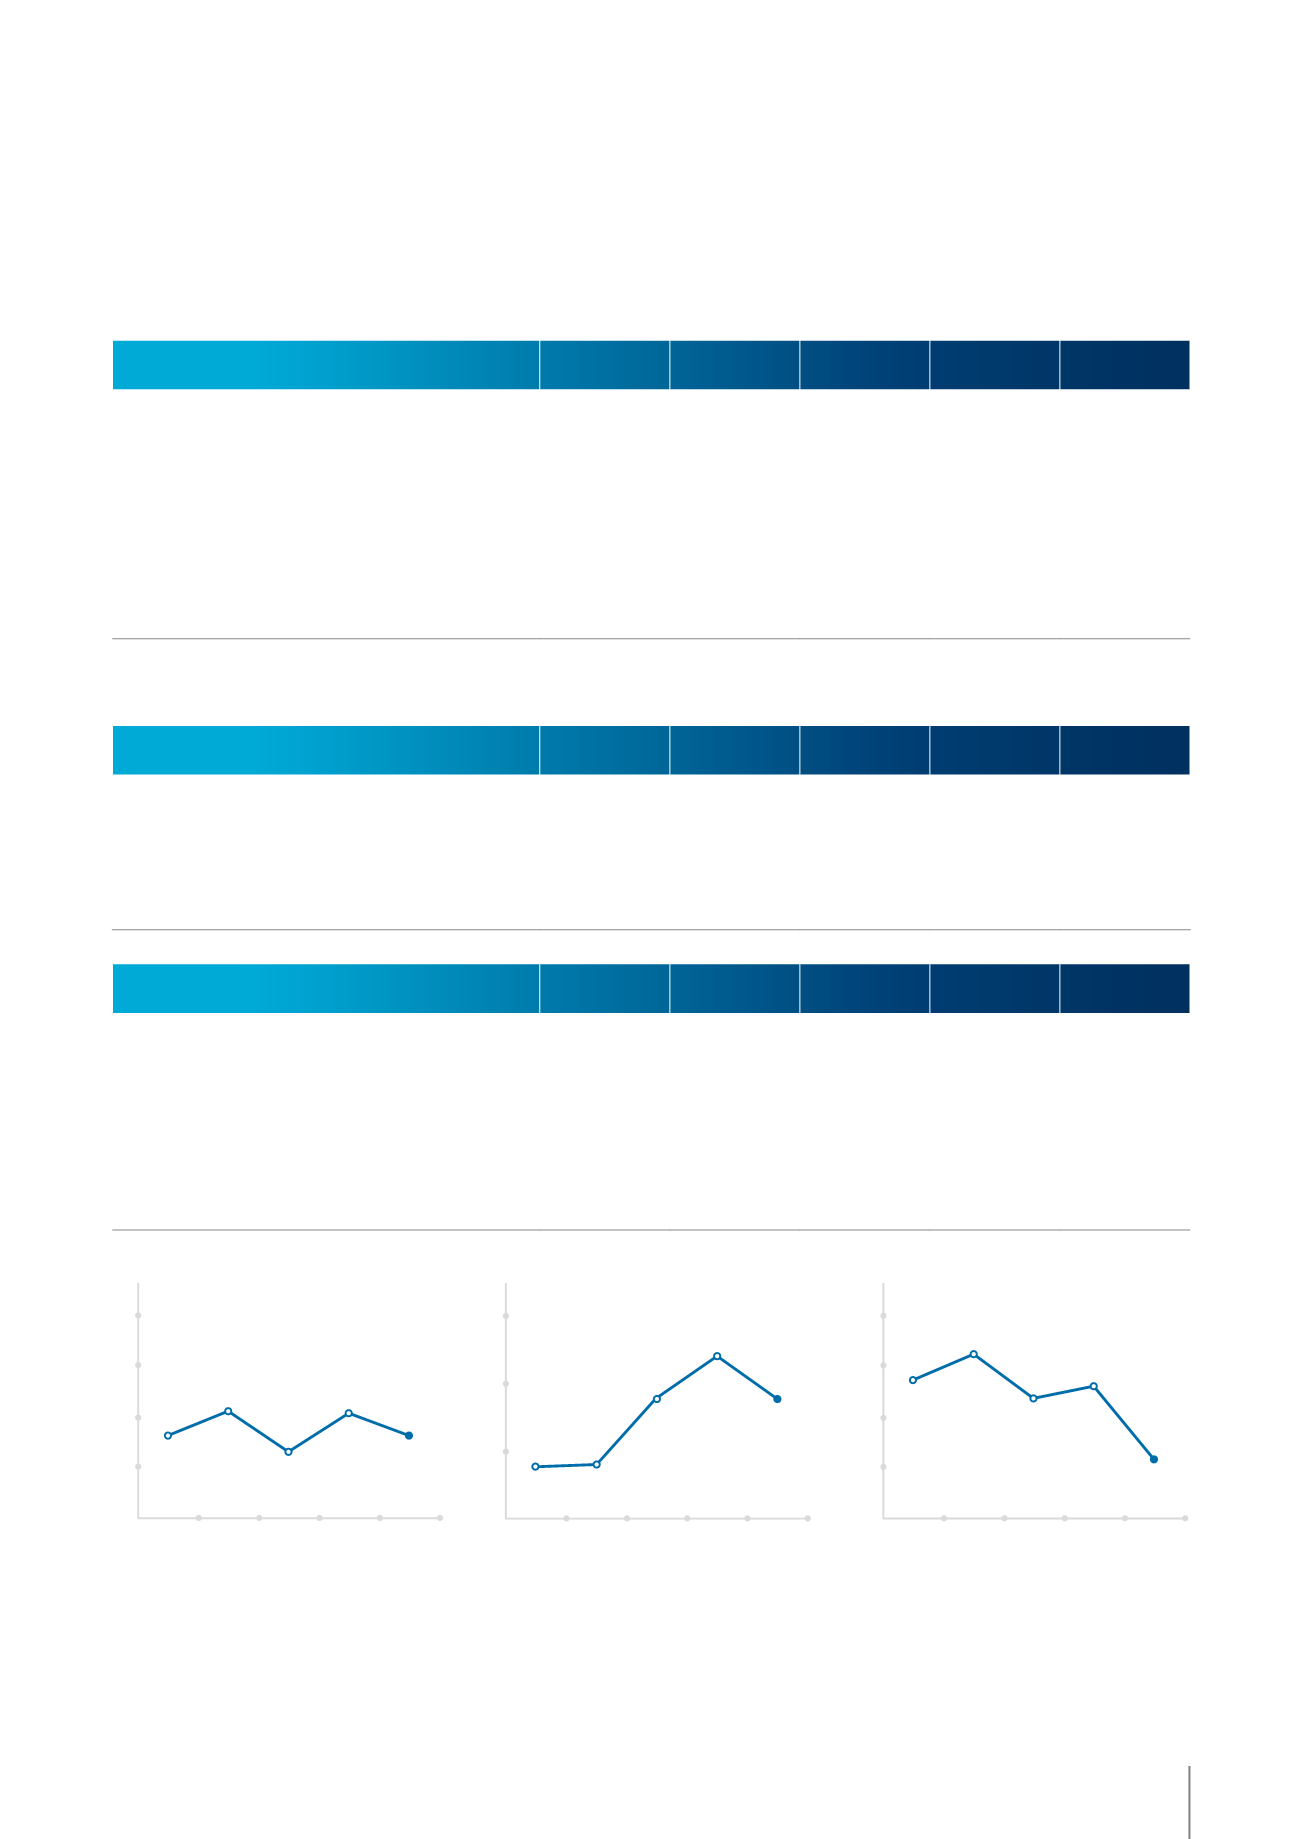
ROCE
NET FINANCIAL DEBT /
EQUITY
REBITDA / REVENUE
PROFITABILITYRATIOS
2012
2013
2014
2015
2016
EBITDA / Revenue
28.4%
30.5%
27.2%
29.4%
28.2%
REBITDA / Revenue
29.1%
30.3%
28.3%
30.2%
29.1%
Gross profit / Revenue
32.3%
33.4%
31.2%
33.0%
30.8%
Operating profit / Revenue
20.3%
22.4%
19.3%
21.6%
19.5%
Profit / Revenue
14.0%
15.3%
13.4%
10.7%
14.7%
FINANCIAL STRUCTURE RATIOS
2012
2013
2014
2015
2016
Net financial debt
90 200
88 141
118 645
162 008
169 751
Net financial debt / EBITDA
1.25
1.18
1.66
1.83
1.85
Net financial debt / REBITDA
1.22
1.18
1.60
1.78
1.79
Net financial debt / Equity
0.83
0.84
1.13
1.32
1.13
Equity / Total equity and liabilities
33.2%
33.7%
30.2%
25.1%
29.8%
Current Ratio
0.61
0.62
0.36
0.85
0.71
ROCE
21.8%
22.9%
20.9%
21.5%
17.9%
01 / KEY FIGURES AND RATIOS
3
KINEPOLIS GROUP
ANNUAL REPORT 2016